Zero-Shot image 출력
연구는 PyCharm에서 진행하고 있는 중이다. CoLab, CLion 등 시도해봤지만 PyCharm이 가장 나은 것 같아서 PyCharm으로 계속 수행하기로 결정했다.
Dataset와 Dataloader 부분의 코드를 작성했다. 프로젝트의 구조는 아래 사진과 같다.

Install package
필요한 package를 설치해준다. 가상환경에서 진행을 하고 있어서 대부분의 패키지는 설치되어 있지 않다. 아래 코드를 돌리는데 필요한 package만 일단 적어두었다.
# Terminal
pip install opencv-python
pip install seaborn
Environmental setup
import os
import cv2
import torch
import numpy as np
import matplotlib.pyplot as plt

from dataloaders.visual_genome import VG, VGDataLoader
from config import ModelConfig
from lib.visualize import *

os.environ['KMP_DUPLICATE_LIB_OK']='True'
아래 이미지를 그리는 과정에서 발생한 에러를 고치는 과정이 있었다. 고치느라 시간을 많이 썼다...
2024.02.21 - [열정/프로그래밍] - [Error] Jupyter notebook에서 matplotlib의 imshow 사용 시 커널 다운 현상
[Error] Jupyter notebook에서 matplotlib의 imshow 사용 시 커널 다운 현상
연구 도중에 발생한 에러... 해결하기 위해 여러 방법을 사용해보다가 드디어 해결했다. 문제가 발생한 코드 n_samples = 10 for i, (im_name, gt_classes, gt_rels, boxes) in enumerate(list(zip(dataset.filenames, dataset.gt_
mydaydream.tistory.com
Load configuration and dataset
conf = ModelConfig()
config.py에 정의해둔 ModelConfig()를 로드하는 도중에 문제가 발생했었는데 해결되었다.
해결 방법은 parse_args()를 부를 때, 안에 인자로 ''를 넣어주면 된다. parse_args('')로 누르면 정상적으로 불러와진다.
2024.02.22 - [열정/프로그래밍] - [Error] Jupyter notebook에서 parser 사용 시 SystemExit 에러
[Error] Jupyter notebook에서 parser 사용 시 SystemExit 에러
나는 PyCharm 환경에서 Jupyter notebook을 사용하고 있다. parser 사용 시 다음과 같은 에러가 발생하였다. 문제 상황 나는 config.py 파일에 argparser를 사용하여 코드에서 사용할 파라미터들을 정의해두었
mydaydream.tistory.com
▽ Output
~~~~~~~~ Hyperparameters: ~~~~~~~~
torch_version : 2.2.0
cuda_version : None
hostname : hostname
data : .\data
ckpt :
save_dir : None
notest : False
save_scores : False
num_gpus : 1
num_workers : 2
seed : 111
device : cuda
lr : 0.001
lr_decay : 0.1
steps : 15
num_epochs : 20
batch_size : 6
val_size : 5000
l2 : 0.0001
clip : 5.0
mode : sgcls
use_bias : False
test_bias : False
edge_model : motifs
pred_weight : 0
loss : baseline
gamma : 1.0
alpha : 1.0
beta : 1.0
rels_per_img : 1024
backbone : vgg16
min_graph_size : -1
max_graph_size : -1
exclude_left_right : False
print_interval : 100
wandb : None
wandb_dir : ./
name : None
debug : False
gan : False
ganlosses : D_G_rec
lrG : 0.0001
lrD : 0.0004
ganw : 5.0
vis_cond : None
attachG : False
init_embed : False
largeD : False
beta1 : 0
beta2 : 0.9
perturb : None
L : 0.2
topk : 5
graphn_a : 2
uniform : False
degree_smoothing : 1.0
warning: Logging using Weights and Biases will not be used: ('project name must be specified if you want to use wandb', None)
# Dataset
train_data, val_data_dict = VG.splits(data_dir=conf.data, torch_detector=conf.backbone != 'vgg16_old')
▽ Output
Loading the split of Visual Genome...
TRAIN DATASET
subj_pred_pairs, pred_obj_pairs 3279 3394
56196 images, 371261 triplets (26261 unique triplets)
Stats: 658768 object (min=2.0, max=62.0, mean=11.7, std=5.7), 269006 FG edges (min=1.0, max=40.0, mean=4.8, std=3.5), 8921388 BG edges (158.75 avg), graph density min=0.0, max=100.0, mean=6.0, std=7.6
loading the original training split first
subj_pred_pairs, pred_obj_pairs 3397 3542
57723 images, 405860 triplets (29283 unique triplets)
Stats: 670591 object (min=2.0, max=62.0, mean=11.6, std=5.8), 297318 FG edges (min=1.0, max=44.0, mean=5.2, std=3.8), 9029910 BG edges (156.44 avg), graph density min=0.0, max=100.0, mean=6.5, std=8.2
VAL DATASET (ZERO-SHOTS)
722 images, 1130 triplets (851 unique triplets)
Stats: 10129 object (min=2.0, max=44.0, mean=14.0, std=7.6), 1026 FG edges (min=1.0, max=7.0, mean=1.4, std=0.9), 173934 BG edges (240.91 avg), graph density min=0.1, max=50.0, mean=2.4, std=5.3
VAL DATASET (ALL-SHOTS)
5000 images, 33203 triplets (5043 unique triplets)
Stats: 62754 object (min=2.0, max=52.0, mean=12.6, std=7.1), 25727 FG edges (min=1.0, max=31.0, mean=5.1, std=4.4), 976590 BG edges (195.32 avg), graph density min=0.1, max=100.0, mean=6.1, std=8.7
TEST DATASET (ZERO-SHOTS)
4519 images, 7601 triplets (5278 unique triplets)
Stats: 65281 object (min=2.0, max=55.0, mean=14.4, std=7.1), 6762 FG edges (min=1.0, max=12.0, mean=1.5, std=1.0), 1107452 BG edges (245.07 avg), graph density min=0.0, max=50.0, mean=1.9, std=4.3
TEST DATASET (10-SHOTS)
9602 images, 19077 triplets (7952 unique triplets)
Stats: 135722 object (min=2.0, max=56.0, mean=14.1, std=7.0), 16565 FG edges (min=1.0, max=27.0, mean=1.7, std=1.3), 2246514 BG edges (233.96 avg), graph density min=0.0, max=50.0, mean=2.1, std=4.2
TEST DATASET (100-SHOTS)
16528 images, 45385 triplets (3647 unique triplets)
Stats: 224204 object (min=2.0, max=58.0, mean=13.6, std=6.7), 37923 FG edges (min=1.0, max=32.0, mean=2.3, std=1.8), 3569324 BG edges (215.96 avg), graph density min=0.0, max=100.0, mean=2.7, std=4.9
TEST DATASET (ALL-SHOTS)
26446 images, 183642 triplets (17659 unique triplets)
Stats: 325570 object (min=2.0, max=58.0, mean=12.3, std=6.5), 145905 FG edges (min=1.0, max=38.0, mean=5.5, std=4.3), 4806730 BG edges (181.76 avg), graph density min=0.1, max=100.0, mean=6.1, std=7.5
# Dataloader
train_loader, eval_loaders = VGDataLoader.splits(train_data=train_data, val_data_dict=val_data_dict,
                                                 filter_non_overlap=False, backbone='vgg16_old')
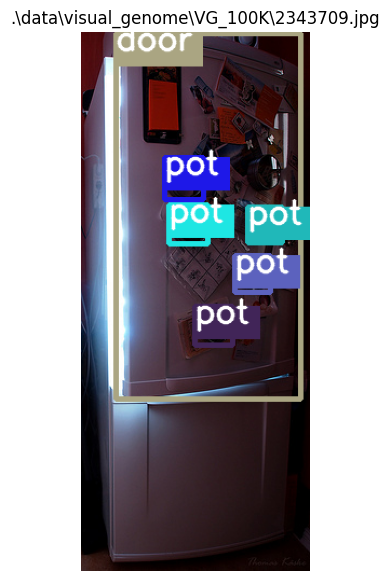
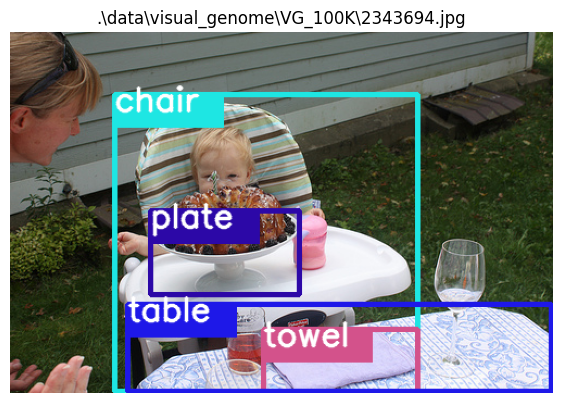
Show some test images with zero-shot triplets
dataset = eval_loaders['test_zs'].datasetn_samples = 10
for i, (im_name, gt_classes, gt_rels, boxes) in enumerate(list(zip(dataset.filenames, dataset.gt_classes,
dataset.relationships, dataset.gt_boxes))):
im_path = os.path.join(dataset.images_dir, im_name)
triplets = []
for r in gt_rels:
triplets.append(dataset.triplet2str('{}_{}_{}'.format(gt_classes[r[0]], r[2], gt_classes[r[1]])))
print('ZS triplets:', triplets)
plt.figure(figsize=(7,7))
im = cv2.imread(im_path)[:,:,::-1]
obj_class_names = [dataset.ind_to_classes[cls] for cls in gt_classes]
plt.imshow(draw_boxes(im, obj_class_names, boxes, fontscale=1, rels=gt_rels))
plt.title(im_path)
plt.grid(False)
plt.axis(False)
plt.show()
if i >= n_samples:
break
▽ Output
ZS triplets: ['bus_under_roof']

ZS triplets: ['pillow_in_trunk']

ZS triplets: ['board_above_truck']

ZS triplets: ['pot_hanging from_door', 'pot_hanging from_door', 'pot_hanging from_door', 'pot_hanging from_door', 'pot_hanging from_door']
ZS triplets: ['elephant_walking on_beach', 'elephant_walking on_beach']

ZS triplets: ['chair_has_plate', 'table_has_towel']
ZS triplets: ['book_has_people', 'face_near_book', 'face_in front of_box']

ZS triplets: ['cap_of_girl']

ZS triplets: ['box_with_bottle', 'bottle_on_box']

ZS triplets: ['roof_under_tree', 'elephant_in_pole', 'fence_along_pole']

ZS triplets: ['roof_on_dog', 'dog_has_roof', 'window_on_dog', 'window_under_face', 'window_in_face']

중간에 몇몇 이미지들의 컬러가 전환되어 나오는 문제가 있다. 해결하면 포스팅할 예정이다...
해결 완료! 아래 포스팅을 보면 된다. 해결 방법은 PyCharm 테마를 Light 테마로 변경해주는 것이었다...
2024.02.22 - [열정/프로그래밍] - [Error] Jupyter notebook 이미지 출력 시 색 반전 문제
[Error] Jupyter notebook 이미지 출력 시 색 반전 문제
PyCharm 환경에서 imshow를 한 결과, RGB 전환을 했음에도 불구하고 색이 반전되어 나오는 현상이 있었다. 문제 상황 PyCharm 환경 Jupyter Notebook 커널 Python 3 cv2의 imshow 사용 아무리 검색해도 나와 같은
mydaydream.tistory.com
bounding box를 그려주는 함수는 아래와 같이 정의되어 있다.
# 파일 경로: ./lib/visualize.py
def draw_boxes(im, obj_class_names, bboxes, fontscale=0.5, lw=4, rels=None, torch_detector=False):

    if torch_detector:
        # resize both the image and boxes
        k = 512. / np.max(im.shape)
        im = cv2.resize(im, (int(im.shape[1] * k), int(im.shape[0] * k)))
        bboxes = bboxes.copy() * k
    else:
        bboxes = bboxes.copy() / BOX_SCALE * max(im.shape)

    im = ((im - im.min()) / (im.max() - im.min()) * 255).astype(np.uint8)
    for obj, (cls, bbox) in enumerate(zip(obj_class_names, bboxes)):
        if rels is not None and (np.sum([rel[0] == obj for rel in rels]) +
                                 np.sum([rel[1] == obj for rel in rels])) == 0:
            continue
        bbox = np.round(bbox.copy()).astype(np.int32)
        bbox[0] = np.clip(bbox[0], 1, im.shape[1] - 2)
        bbox[2] = np.clip(bbox[2], 1, im.shape[1] - 2)
        bbox[1] = np.clip(bbox[1], 1, im.shape[0] - 2)
        bbox[3] = np.clip(bbox[3], 1, im.shape[0] - 2)
        color = get_color(obj, cls)[::-1]  # RGB
        color = (int(color[0]), int(color[1]), int(color[2]))   # to get around numpy-cv2 issue
        cv2.rectangle(im, (bbox[0], bbox[1]), (bbox[2], bbox[3]), color, lw)
        cv2.rectangle(im, (bbox[0], bbox[1]), (bbox[0] + len(cls) * int(fontscale * 20), bbox[1] + int(fontscale ** 0.5 * 30)), color, -1)
        cv2.putText(im, cls, (bbox[0], bbox[1] + 15), cv2.FONT_HERSHEY_SIMPLEX, fontscale, (255, 255, 255), 2, cv2.LINE_AA)
    return im
이제 detection 부분의 학습 코드를 짜면 된다.